Power BI Visuals now support Custom Formatting for measures using Calculation Groups!
The Power BI team has been doing a lot of incredible work. The most recent update which I got wind of is Custom Formatting of measures is now supported for Visuals.
This has already been deployed to the Power BI Service and if you download the
latest version of Power BI Desktop (Version 2.83.5894.961 as at 03 Aug 2020) it has the new features. This means you can use this TODAY!
Previously this was only supported for tables and matrixes.
As with my previous blog post (How to create and use Calculation Groups in Power BI Pro & Premium / Azure Analysis Services / SQL Server Analysis Services 2019) where I had detailed how to configure Custom Format Strings for measures using calculation groups there is no code change that needs to happen if you have implemented this already.
I am going to show you below what this now looks like in Power BI.
To get this working I created my Power BI report and I put in my measure called [Values] and the Date into the Axis

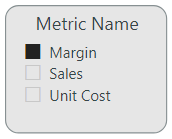
I then created a Slicer and put in the Metric name from my Calculation Group

This is what the same visual looks like below when using the Metric Names from the Calcualtion Group
Margin which is formatted as a percentage (%)

Sales which is formatted with the currency ($)

Unit Cost which is formatted as a fixed decimal point (0.00)

In the GIF below I will show you how I move between each of the Custom Format Strings.
Summary
In this short and sweet blog post I have shown the update to Power BI which is already available for you to use the Custom Format Strings with visuals in Power BI too.
Any questions or comments are always welcome. Thanks for reading.


I’ve noticed that for my calculation groups, I have no issues with Time Intelligence. However, if I create a calculation item w/ another measure referenced as the expression (e.g., “Sales” – similar to this example), it will override the data type all of my other measures (outside the calculation group) from their native type to “variant” which then breaks the formatting in for my standard measures in certain other visuals.
Have you experienced this issue at all?
Hi there
Yes that will happen because the calculation group will only work on the SELECTEDMEASURE which is being used in the Calculation Group.
How did you made this GIF? Is that was specific program?
Hi Artur, thanks for the comment.
I use this awesome program called Screen to Gif here is the link: Screen to GIF
Hi, Mr. Gilbert, How did you add the vertical black line when moving around in Date Axis? Thanks
Hi there
I was just highlighting it with my mouse.
The latest version of Power BI Desktop does allow you to create a vertical line!
[…] Power BI Visuals now support Custom Formatting for measures using Calculation Groups! […]