Create Currency Formatting Strings using Calculation Groups in Power BI Pro & Premium / Azure Analysis Services / SQL Server Analysis Services 2019
Below are the steps on how I got the calculation groups to work for Currency formatting strings when the currency format string will be displayed per currency shown.
Following on from my previous blog post (How to create and use Calculation Groups in Power BI Pro & Premium / Azure Analysis Services / SQL Server Analysis Services 2019) on how to create Calculation Groups, in this blog post I will show you how to use Currency Formatting Strings to show with different currencies.
This is what it will look like at the end.

For all the examples below I am using the awesome Tabular Editor (which I highly recommend you download and learn to use!)
Making Sure you have got a valid Currency Format String
When I first started looking at the calculation groups and changing the currency formats, I thought that my existing currency format was correct. Boy was I wrong and once I found that out and corrected it, my Currency Format Strings started working.
As per the Microsoft documentation found here Dynamic format strings for currency conversion I had to make sure that my Currency format followed the following pattern.
- Currency Symbol with double quotes around it, then the number format
- Next is the negative value which once again was the Currency Symbol with double quotes around it, then the number format
- And finally, the last value was once again the Currency Symbol with double quotes around it, then the number format
Below is an example for the AUD ISO Currency Type that we use here in Australia
"$" #,0.00;-"$" #,0.00;"$" #,0.00
Creating the Currency Format String in a calculation group
Below are the steps to create the currency Format String Expression, which will then change the currency format based on the currency selected.
NOTE: Once again before starting make sure you got your column in the ‘Currency’ table with the FormatString
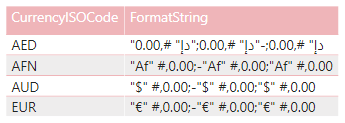
Below are the steps that I did in order to get it working with the calculation group.
- I went into my model using Tabular Editor
-
I then right clicked and selected Create New, Calculation Group
-
I have it the name of Currency Symbol, and I had this created
-
A very important step is to set the Precedence for the Calculation Group
- NOTE: The higher the precedence will always be executed before the lower ones.
- For the Currency Symbol calculation group, I gave it a precedence of 30, because I want this to be evaluated before my Metric Calculation Group.
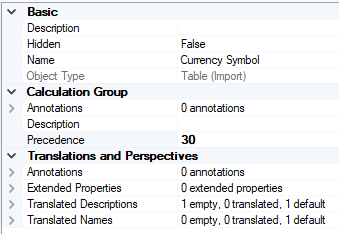
- NOTE: The higher the precedence will always be executed before the lower ones.
-
I then clicked on my column called Name and renamed it to “Reporting Currency”
-
Following on from this I then needed to create my Calculation Item (This is where the magic happens and I can define not only the expression for the calculated item, but also the Format String Expression
- I right clicked on Calculation Items and selected New Calculation Item

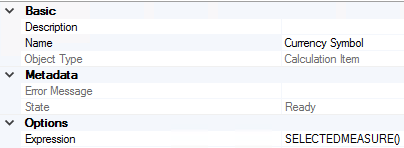
- I have it the name Currency

-
Now, because I wanted the Measure value to not change, I put in the following expression SELECTEDMEASURE()
-
Finally, I can now put in the secret sauce which will allow my Currency Symbol to change based on my disconnected table. And to do this I put in the following syntax into the Format String Expression
- Please note that I got the code from the following SQLBI.COM article which is highly recommended reading: Controlling Format Strings in Calculation Groups
VAR MeasureName =
    SELECTEDVALUE ( Metric[Metric], SELECTEDMEASURENAME () )
// Which measures do you want to SKIP and NOT apply the FormatString
VAR SkipConversion =
    SWITCH(
    TRUE(),
        MeasureName = "Orders",1,
        MeasureName = "Margin",1,
        MeasureName = "Avg Order Size",1,
        0 )
VAR CurrencyFormat =
    SELECTEDVALUE(
    'Currency'[FormatString],
    SELECTEDMEASUREFORMATSTRING()
)

VAR FinalIf =
    IF (
        SkipConversion,
        SELECTEDMEASUREFORMATSTRING (),
        CurrencyFormat
    )
RETURN
    FinalIf
- What this Syntax is doing above is the following:
-
Line 1-2:
- It is getting the Metric value from the Metric Calculation Group (Which I created in my previous blog post (How to create and use Calculation Groups in Power BI Premium / Azure Analysis Services / SQL Server Analysis Services 2019)
-
Line 4-10:
- What I am doing here is to SKIP applying the currency conversion to measures which would not be used.
- In my example it is for the measures called “Orders”,”Margin”,”Avg Order Size”
-
Line 11-15:
- Here I am getting the Currency Format String from my Currency table on the [FormatString] column and then using the DAX measure SELECCTEDMEASUREFORMATSTRING
-
Line 17-22:
- This is where I am looking to see if I must skip the measure formatting of the currency (which will then use the format string from the measure in the Metric Calculation Group) or to use the CurrencyFormat defined in the previous lines 11-15
-
Line 23-24:
- The final step is to return the measure
- If I had to try and simplify it, all that is happening it is taking the value from the Format String in the table ‘Currency – Data’ and applying it to each Currency Column name that is put into the Power BI Report
-
This is what it looks like
- I deployed the changes and processed the required tables.
-
The final step is to test it and see if it works.
- I created a matrix where I put in the following below
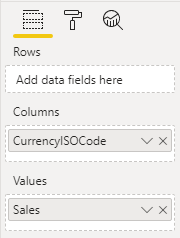
- I then also created a table with dates to show you a different currency over time and this is what it looked like below.
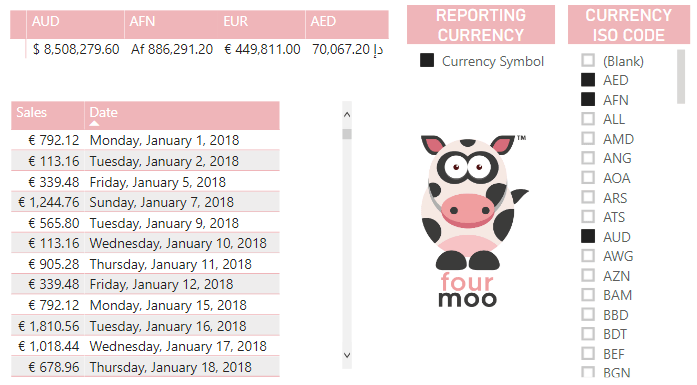
- Not only did this show all the currencies that I had selected and their relative transaction amounts with the formatted symbol.
- Now that is really awesome!
Summary
In this blog post I have shown you how I used the Currency Format String with Calculation Groups to show different currencies in their native formatting strings.
Here is a CSV file with all the Currency Formatting strings which you can use: Currency Format Strings.csv
I hope that you found this useful and it will enable you to create awesome reports.
Thanks for reading, any comments or suggestions are most welcome



[…] Gilbert Quevauvilliers walks us through formatting currencies via calculation groups in Power BI and…: […]
Hello,
we have implemented the calculation group logic in a SSAS on Azure tabular model to manage dynamic currency format string based on specific selected measures. The solution works fine if we browse analyze the model using PowerBI.
The performance of this feature decrease dramatically when we are browsing data using excel (16.0.13127.21624, 64bit) expecially when the drilldown of the rows extracted are high. the scenario tested involved about 5.000 rows of pivot table, with just 3 attributes on rows and 5 Measures on column.
The query become so slows that after 13 minutes we receive back a “out of memory” issues. Removing the format string expression within the calculation items (what ever is the expression set, even with “#,###” without any kind of control), the performance come back brilliant.
The datamodel is about 70 GB, and the Azure SSAS is running on a S8 tire.
Is it possibile to explain why using excel, the calculation group decrease the performance of the Query statement at the growing of the number of rows extracted while in powerbi this issue is not appearing? Is because the MDX generated by excel is not optimized or there are any other tecnical reasons that should be investigated?
Best Regards,
S.
I would have a look using DAX Studio to see the Query that is sent through.
It could be the MDX.
Also for the format string expression is there a lot of DAX in this?if possible to post what this is?
Or if its sensitive you are welcome to email me.
Ciao Gilbert, thank you for the reply!! if you send me in private your personal mail, i would share with you dax query sent to engine when the calculation group is used in powerb and the MDX query sent to the engine when excel is used.
Nevertheless, the issue appear even when we put a simple string in the format string expression like “$ #,####.00”. So without any dynamic code applyed.
Best Regards,
S.
Thanks I have sent you an email.
Hi,
Many thanks for the article. Im trying to apply the same calculation group but with an additional formatting.
I’d like to format the amounts in Millions. However, I dont know how to add the 2 formatting conditions:
1, the currency format symbol
2. the amounts in millions.
Could you please assist me?
Regards
Manuel
Hi Manuel,
What you would need to do is to create another calculation group which you could then format for Millions?
Hi again,
I was able to adjust the: Format String Expression
VAR MeasureName = SELECTEDMEASURE ()
VAR CurrencyFormat = SELECTEDVALUE ( ‘DimFxCurrency'[Currency Format] , “#,0” )
VAR Decimals = “0.0”
RETURN
SWITCH ( TRUE() ,
MeasureName > 1000000 , CurrencyFormat & “#,0,,.00 M” ,
MeasureName > 1000 , CurrencyFormat & “#,0,.# K” ,
FORMAT ( MeasureName , Decimals )
)
However, in the matrix viz I get the result with a 0 in front (some sort of leading 0 in the front of each value)
example: 068.74 M
if there anyway to eliminate the first 0?
many thanks
Manuel
Hi Manual,
You can just change the formatting as shown below.
"#,#"from"#,0"Just change the last zero to hash.
Many thanks Gilbert.
Your articles are really helpful. I follow them constantly to learn more about power Bi.