#PowerBI Premium Performance – Part 1 | How to use the new XMLA End Point to see how much memory your datasets are using
With the new XMLA end points, it opens a whole new world of possibilities with Power BI Premium.
This is part 1 of a series that I am going to be putting together series on how to make sure when moving to Power BI Premium you can ensure that you get the best performance possible. In the future blog posts, I will cover how to find what is consuming all the memory, dataset refreshes, Row Level Security, CPU Performance and more.
I thought it would be a good start to be able to first measure how much memory your datasets are currently consuming in Power BI Premium, I personally think that this is one of the key fundamentals to be able understand and view it graphically.
Below are the series of blog posts on Power BI Premium Performance
- Part 1 | How to use the new XMLA End Point to see how much memory your datasets are using
- Part 2 | Optimization of your Power BI Model
- Part 3 | How does a dataset refresh affect performance?
- Part 4 | How does Row Level Security affect performance?
- Part 5 | How much memory will the PBIX consume?
I will show you how to do this using Power BI Desktop (My favourite Analytics Tool!)
Let’s dig in.
Installing the latest Client Libriaries to connect to Azure Analysis Services
I know that you might be thinking why do I need these for Analysis Services? In my understandinb behind the scenes Power BI Premium is running a version of Azure Analysis Services.
The first thing that I did was to install the latest Client Libriaries, which I am certain allows me to connect to the XMLA end points in Power BI Premium.
I installed all the versions from the link below: Client libraries for connecting to Azure Analysis Services
NOTE: You are welcome to try the steps below without it installed, if it does not work them possibly install them from the link above.
Getting the Workspace Connection and Database
If you want to follow along you can download the Power BI Template I have created here: XMLA for PBIX – Template.pbit
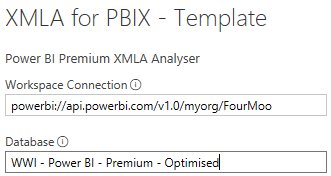
I open the file and it first prompts me for my Workspace connection and Database

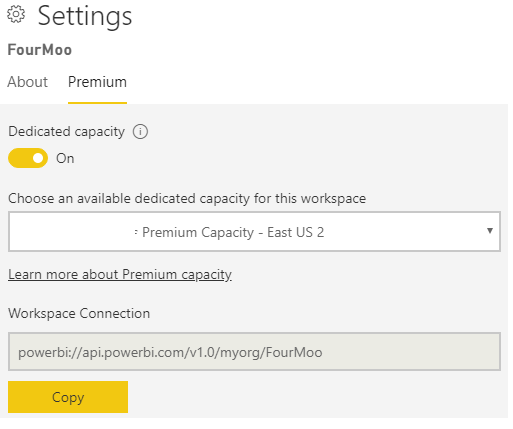
In order to get the Workspace Connection, I went to my Power BI Premium Workspace, clicked on Settings

I then clicked on Premium at the top.
As shown below, I can see my Workspace Collection as shown below. I then clicked on Copy

I put this into my Workspace Connection in my parameters

Next to get the database, this is the dataset name, I went to my datasets in my App workspace and copied a dataset name
NOTE: I could copy any dataset name, it is just required to make the connection.
I then pasted this into the database parameter

I then clicked Load
Log in credentials to Power BI Premium
Next, I am prompted for my log in credentials.
I put in my username and password that I use to log into Power BI

NOTE: Make sure you select the Database authentication
Then I clicked Connect
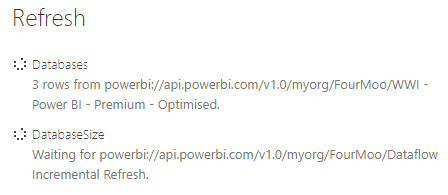
I could then see my data being loaded via the XMLA End Points

Power BI Premium Memory Report
Once it was done, I could then see my Power BI report with the data returned from the XMLA End Points
There are multiple Pages which details the following below:
Databases by size
This shows each database and the size in MB.

Databases by Record count
This shows each database and how many records each database has.

Tables and partitions
This allows me to select your Database and see the tables and partitions that I have in your database. Along with the record counts and Total memory size

Top10 Partitions
If I have configured your data with incremental processing, you will then see the top 10 partitions. If not, it will just display the top 10 tables.

Size by rowcount
The final page shows me the Total rowcounts, as well as other information when you hover over the chart. I do have the option to not select any databases, which will show me which table is consuming all my memory or I can select individual databases.

I would like to thank Kasper De Jonge @KJonge for allowing me to use his original Power BI Template file (New SSAS memory usage report using Power BI) as a starting point for this project.
I do hope that you enjoyed this first blog post in the series.
Once again here is the link to the Template File: XMLA for PBIX – Template.pbit
As always if you have any questions or suggestions please let me know.

Hey Gilbert, I am getting this error (DataSource.Error: OLE DB: Azure Analysis Server returned the following error: Unauthorized) I am using the database option and using my PBI credentials and my content is stored in premium capacity. Any ideas?
Hi there
Thanks for the comment.
There is currently an issue with the XMLA end points which is planned to be resolved by 28 Apr 2019
More details can be found here: https://powerbi.microsoft.com/en-us/support/
Thanks Gilbert, now that the XMLA is back up I am still getting some errors. Specifically – OLE DB or ODBC error: Query ‘DatabaseSize’ (step ‘AutoRemovedColumns1’) references other queries or steps, so it may not directly access a data source. Please rebuild this data combination..
Any ideas on this one?
Hi James
I opened up by PBIT and refreshed it and it worked successfully.
Did you ensure that you installed the latest OLE Drivers?
Hi,
I’m having this issue:
Formula.Firewall: Query ‘DatabaseSize’ (step ‘Invoked Custom Function’) references other queries or steps, so it may not directly access a data source. Please rebuild this data combination.
Do you have any workaround for it ?
Thanks!!!
Hi there
I am not sure why that is not working, it did for me in the past.
[…] Part 1 | How to use the new XMLA End Point to see how much memory your datasets are using […]
[…] Part 1 | How to use the new XMLA End Point to see how much memory your datasets are using […]
[…] Part 1 | How to use the new XMLA End Point to see how much memory your datasets are using […]
Hello,
Getting error “OLE DB: Errors in the OLE DB provider. Failed to load managed ADAL component.”
Hi Jason
Do you have the latest version of PBI Desktop installed?