BI-RoundUp – Power BI (Nov 2017 Desktop Update – Single Sign-On for Gateway Data Sources)
It is the start of the second week, and that meant that there was an update for Power BI Desktop, as well as some of the other related Services. I do hope you enjoy this weeks updates.
Power BI – Nov 2017 Desktop Update

As you can see we now have the Power BI Desktop update for November 2017. And as I do every month, I will go through what I feel are the highlights up the recent update.
Reporting
There is a lot to highlight in this section so below are some of the details.
-
All below relates to both table and matrix.
- Cell Alignment, which as you can see above you can align them left, right, center and Auto
- Rule based Conditional formatting, which you can also see in the image above.
- Next there is the option to control the ordering of your images that you have in your selection pane, which is a great improvement.
- Now you can also lock the objects in your report, so if you are doing a demo or showing someone the report, none of your objects will move.
- ESRI Plus subscription available for ArcGIS. This allows you to use your ESRI subscription within the Power BI Service, with regards to more geocodes, additional base maps, living Atlas reference layers enabling you to add more context. As well as world demographics with the Infographics features.
-
Query Reduction has now been implemented for Live Connections or DirectQuery.
- What this will do is for example when you are using slicers it will wait until you have made your entire selection, and once you click Apply will it then send one query. In the past it used to send one query every time you clicked on a slicer.
- Filtering has also been improved so that there is no longer a 500 value limit.
-
There have been 4 new Custom Visuals added.
-
Image Timeline – This allows you to display events along a timeline with images. And then you can interact with them.
-
Social Network Graph – Which will show visual connections between people.
-
Venn Diagram – to find commonality between different categories
-
HTML Viewer – Lets you display HTML text strings, which enables your text to look a lot better
-
Analytics
There is now support for Cell-Level formatting for Multi-Dimensional Analysis Services to Multi-Row Cards this month.
Data Connectivity
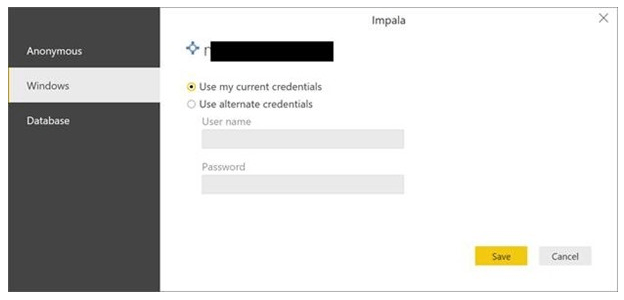
There is now support for Windows Authentication for the Impala connector

Query Editing
There have been even more updates for the Columns from Examples.
The additional items below are:
-
Basic Conditional Column – Define a mapping between values in an input column and the desired output
-
Conditional column ranges – Define a new column with non-uniform ranges (I am thinking that they mean different length requirements)
-
Null fallback – This is where you could have multiple columns and you want to extract the values that are NOT null
-
Bucketing (Uniform Ranges) – Define an upper/lower boundaries for a range for a certain row and it will try and copy the uniform ranges
You can find all the details as well as the video here: Power BI Desktop November Feature Summary
Power BI – Single Sign-On for Gateway Data Sources

There is now single Sign-On for selected data sources that use DirectQuery via the On-Premise Data Gateway.
Currently the supported data sources are:
- SQL Server
- Teradata
- SAP HANA
And there will be future support for:
- Oracle
- Impala
- SAP BW
- Spark
- More to follow
You can find all the details here: Announcing Single Sign-On Support when connecting to data sources from the Power BI Service


