Power BI – (March Desktop Update, Theme’s Generator, Esri New Technology Integration Award, K2 Process Content Pack, Advanced Search Solution Template, Project Service Automation for Dynamics 365 Solution Template, New Custom Visual 3D Pie Chart)
There has been a whole host of updates to Power BI in the past week which is great to see, so I hope that you enjoy reading this as much as I enjoyed putting it all together.
Power BI – March Desktop Update

In this month’s updates there are a whole host of great updates, and the Power BI Team has been very busy. So I will go through each section below in what I think are important highlights.
Report View
This is where the majority of the updates and new additions are, which I really like because it means that there is now even more capability to customize my Power BI Reports.

The first addition is the ability to theme the reports. I know that this is something people have been asking for. And currently it does seem rather manual and the Power BI Team does speak to it in the YouTube video that this is the first version and that they will update it as the months go on. Already there is a Theme Generator by Charles Sterling for this, which you can find further down in my blog.

Next is the Preview Matrix, which has a lot of updates, one of which is performance improvements. As well as a whole host of formatting options (stepped layout, drilling into hierarchies) which enabled me to fit more data into the same area. I also liked the fact that you can now do cross filtering both from the Preview Matrix, as well as from other charts. Just remember that you need to enable this in the Preview Features to gain access to the Preview Matrix.

Even though this is something that appears quite small, I know personally in the past this is something that I wanted to change the color of the text.

Another very handy slicer is the new Numeric range slicer. The trick with this first version is that you can only use it on a Numeric column and not YET on a Calculated measure. But it does make it quick and easy to slice the data.

I have actually been asked in the past if I was able to put in the percentages on Pie or Donut charts, and now the Power BI team has released this functionality with all the different options.

And finally in the reporting section is the ability to Cross-highlight using multiple series. So this means that I now can select anything combination in my series and it will show the results.
Analytics
Under analytics it is good to see that Clustering is now generally available.
Data Connectivity
In terms of data connectivity it is good to see that you can now connect to the additional sources below.
- Azure Analysis Services Connector
- Azure Data Lake Store
- DB2 Connector – Option to specify package collection
- Combined Binaries – Gives you the option to select the sample file.
Query Editor
And finally in the Query Editor there now is automatic detection for the delimiter character when you split a column. You can still change this if the automatic detection is not right.
You can find the blog post here: Power BI Desktop March Feature Summary
Power BI – Theme’s Generator

Following on from the update of Power BI Desktop for March and the ability to create theme’s Charles Sterling from the Power BI team as released a very easy way to create the themes that you require.
Click on this link http://thememaster500.azurewebsites.net/
Once there you get the image as shown above. You can then select the color pallet that works for you.
Then click Apply and it will download the JSON file, for you to import into Power BI.
Power BI – Receives the ESRI New Technology Integration Award

I think it is great when other providers acknowledge the work done by the Power BI Team. And here is an award from Esri New Technology Integration Award for 2017.
You can read the blog post here with all the details: Microsoft Power BI receives the Esri New Technology Integration Award for 2017
Power BI – K2 Process Content pack

This is another really good example from Power BI and K2, so if you are an existing K2 customer this is a very quick and easy way to gain insights into your data.
You can find the blog post here: Explore your K2 Process Analytics Data with Power BI
Power BI – Advanced Search Solution Template for Bing News

Here is another solution template in which you can put in some search terms and the solution template will go and use the Azure services and create a report that will allow you to view sentiment, topics, organizing people and organizations into locations.
You can find the details here: Announcing the Advanced Search Solution Template for Bing News
Power BI – Project Service Automation for Dynamics 365 Solution Template

And here is yet another solution template this time for Microsoft Dynamics 365 for Project Service automation. This template will enable the business to get a set of reports for everything focused around the Project Service Automation in Dynamics 365
The blog post details can be found here: Announcing the Power BI solution template for Microsoft Dynamics 365 for Project Service Automation
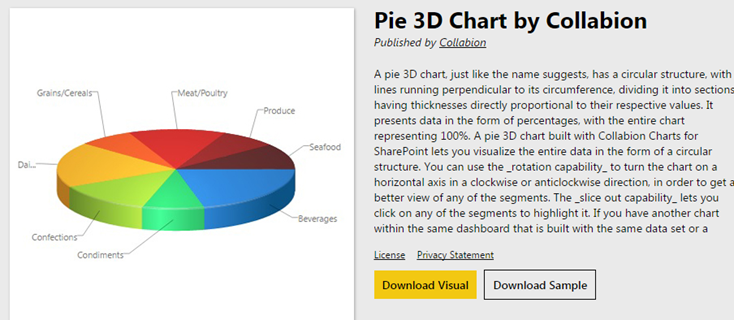
Power BI – New Visual 3D Pie Chart

As you can see above there is another new Custom Visual, the 3D Pie chart available in the Power BI Custom Visuals Gallery
You can find the visual here: Pie 3D Chart

thanks