Power BI – How to Filter Slicers dynamically
I had a requirement where I had a related table (or dimension table) in which was used as a slicer. But when it was changed to a slicer it was showing all the values in the related table, even if there was no data.
So below I show and explain how to overcome this and show how to filter a slicer dynamically.
Example of current slicer
Below I will show what the default slicer looks like when you create it in your Power BI report.

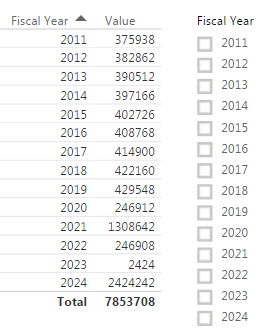
As you can see above on the left hand side is my table, in which I have the Value and then the Fiscal Year.
And currently my Fiscal Year Slicer has Fiscal Years from 2011 – 2031.

And in my dataset we have data until 2024

How to create a slicer with a calculated table
Below I am going to show how to create a calculated table, which will only have the values where there is data.
-
The first thing you have to ensure before you create your calculated table is that you have created your relationships between your tables.
- NOTE: This is very important for the calculated table to work below.
-
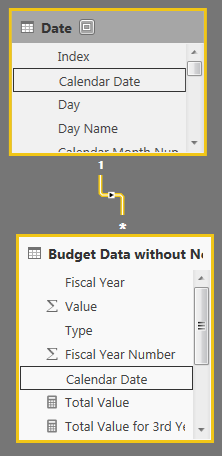
As with my example you can see below that there is a relationship between the Budget data without new Year and the Date table.
-
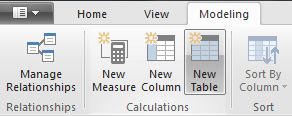
In your Power BI Desktop click on the Modeling tab and then select New Table
-
I then put in the following DAX Syntax below, with the explanation afterwards of how it works.
Fiscal Year – Slicer =
CALCULATETABLE (
ADDCOLUMNS (
SUMMARIZE ( ‘Budget Data without New Year’, ‘Date'[Fiscal Year] ,‘Date'[Calendar Date]),
“Not Used”, 1
)
)
- As you can see above I started with my CALCULATETABLE, which creates the calculated table.
- Next is where I have the ADDCOLUMNS, which will be which columns I want to add.
-
And then finally the SUMMARIZE, and this is where the DAX pattern comes to life.
-
The first selection in the SUMMARIZE is the table as shown with the Intellisense from Power BI Desktop.

- So with my example I put the table as ‘Budget Data without New Year’ highlighted in Blue.
-
Now where it asks for the GroupBy_ColumnName1 this is where I actually selected the column name from my Date table.
- And with my example I selected the ‘Date'[Fiscal Year] column highlighted in Green.
- This is because the Slicer I wanted to use was the Fiscal Year.
-
Then the final column was the ‘Date'[Calendar Date] this is so that later I can create the relationship between the two tables.
- NOTE: You can add additional columns if required.
-
And then finally because I used the SUMMARIZE I need to create an Expression as part of the requirement.
- So for that I created the “Not Used”, 1 highlighted in Orange.
- And what I did here was to give it a column name of Not Used and a Value of 1, so this satisfies the SUMMARIZE syntax.
- What the above is actually doing from my understanding is that it is using the existing relationship between the Budget data without new Year and the Date table and only returning the Fiscal Years where there is data.
-
-
I then pressed Enter to create the table.

- What I then did was to Hide the Not Used Column, so that this did not confuse the people using the report.

-
So as a quick test I then put in my Fiscal Year and changed it to a Slicer and I expected to only see Fiscal Years until 2024 because that is when I have data.
- A final thing to note is that by using the Calculated Table it is compressed, fast as well as always being updated on each refresh.
Creating a relationship from my Calculated table to my data (Fact Table)
The final step I did was to create a relationship from my Calculated table to my Data or Fact Table (Budget data without new)
- The reason for doing this is so that when select an item on the Slicer it will filter due to the relationships being in place.
-
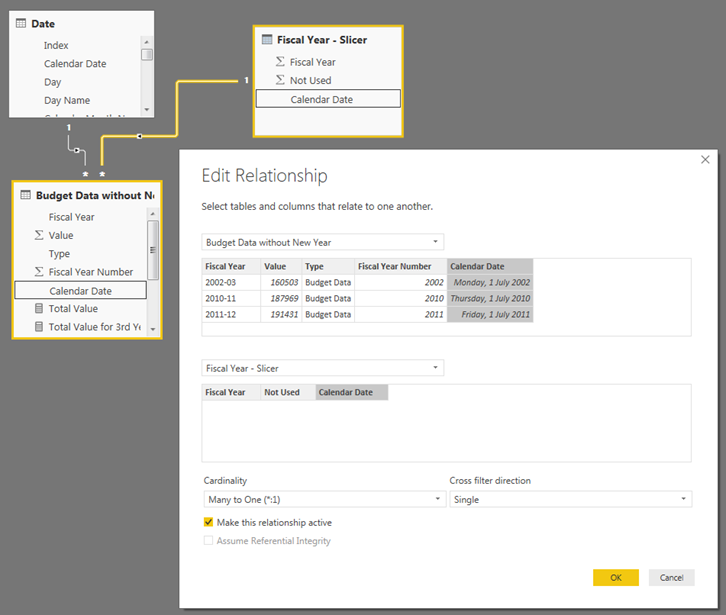
So I went into the Relationships view and created the following relationship as shown below.

- As you can see above I created the Relationship between the Budget data without new and my new calculated table Fiscal Year – Slicer and on the Calendar Date columns.
- NOTE: As you can see from the image above it does appear that the Fiscal Year – Slicer table does not have any data, it does and I think that this is possibly a small bug when creating a calculated table.
So now when I have my report and I have my Fiscal Year slicer I only see the Fiscal Years where I have data.

And if I click on a particular Fiscal Year it filters as expected.

Conclusion
So in conclusion this is a great way to create slicers in which it will only have a slicer value where you actually have data. And this works really well when you have data that has a lot of historical values that are not used in the current context.
As with past examples you can download the Power BI Desktop File here: UnPivot Other Columns.pbix


This could be very useful. Is there a solution to models with 2 fact tables? I have a model with a sales table (fact) and an order table (fact) and then several dimension tables. I want to make my item slicer dynamic, but it is not possible to create a relationship from the new calculated table to both fact tables when Cross filter direction set to both.
Hi there
Yes that is correct, and I would suggest not trying to use the Cross Filter set to both, and only apply it when absolutely needed.
I would suggest changing all the relationships to Single Direction and see if that solves your issue.
Works great, when working with many to one relationships, doesn’t seem to work with many to many.
Any ideas of a work around?
Hi there, very often when using a many to many it creates complex issues. Ideally if you could model it, so that it does not use many to many that would be ideal. Otherwise the filtering for the slicers can become quite complex.
Gilbert – I’m having a similar challenge, I think. I tried your pattern with no luck. Posted here: https://community.powerbi.com/t5/Desktop/Dynamic-Date-Slicer-Based-on-Parameter-Choice-and-Filter/m-p/604638#M287832.
Hi there thanks for contacting me.
I read your issue and just so that I can understand, you are looking to have the Date slicer change based on other filters?
Guys, why does this have to be sooo difficult. I dont understand why this is not available out of the box.. very bad tool powerbi. I wouldnt be proud of this work around. It can break in all types of scenarios..
Hi there
As I am sure you can understand not all tools can have everything out of the box.
I appreciate the comment, it is always good to know what others think. And I would say at least there is a workaround to get it done!
I think I am missing something here – why can’t you just add a filter on the slicer where “Value” is not blank? Should work if you date table is already related to your fact table.
Zev
Hi Zev,
You are indeed 100% correct. When I did this blog post in Jan 2017 this was not an option.
Gilbert., we had implemented your proposed solution in a few projects. Out of a sudden it seems that it doesn’t work anymore even though we haven’t done any changes. Have you experienced the same issue and do you have insights, why it doesn’t work anymore? Would you also propose to add filters on the slicer or is there another option with DAX?
Hi there
What I would do is to use the technique from SQLBI where you can filter the slicers based on a measure.
I typically create a measure called Filter Slicer = COUNTROWS(FactTable)
I then put this measure on my Slicers. The Countrows DAX measure is super fast and will filter the data in the slicer based on the users selections!
I spend about 2 hours trying to implement the SUMMARIZE formula with no results whatsoever.
Then I spend 5min creating this measure and it works like a charm😁
Hi Remco
Thanks for the kind words and I am happy that it helped!
Hello, This is a nice solution, is there a way to add syntax to this code to handle blanks, in your example if the Dates fields had blank, put something in that cell, like “Blank”
Hi Peter
What you could do, is something along the lines of:
VAR MyMeasure = [measure Name] RETURN IF(ISBLANK('date'[date]),"NO DATA", MyMeasure)Hi,
I tried implementing this, and only got it to appear to work if I switched on cross-filter directionality to “both”.
I modified the calculated table to group by a field which has individual dates (so at a level of “day”) and have a column for each date, as I don’t want to group on higher level of granularity than per day.
If I put my calculated table into a visual listing all dates (in a table) and then click on a chart elsewhere (displaying data from my fact table), it works and updates my list of dates shown in the table visual. As soon as I change the visual from a table to a slicer, it stops working and shows all dates again. I want the date slicer set to “between”, but showing it as a vertical list so it should look more or less exactly like the table visual, but it doesn’t. Don’t understand why!
Hi Ashely,
Could this be due to the calculated table Group by field?